MedViz
Interactive visualization for biomedical literature at scale.
An AI-powered platform for exploring research patterns, temporal trends, and scientific connections.
Discover MedViz →About this work
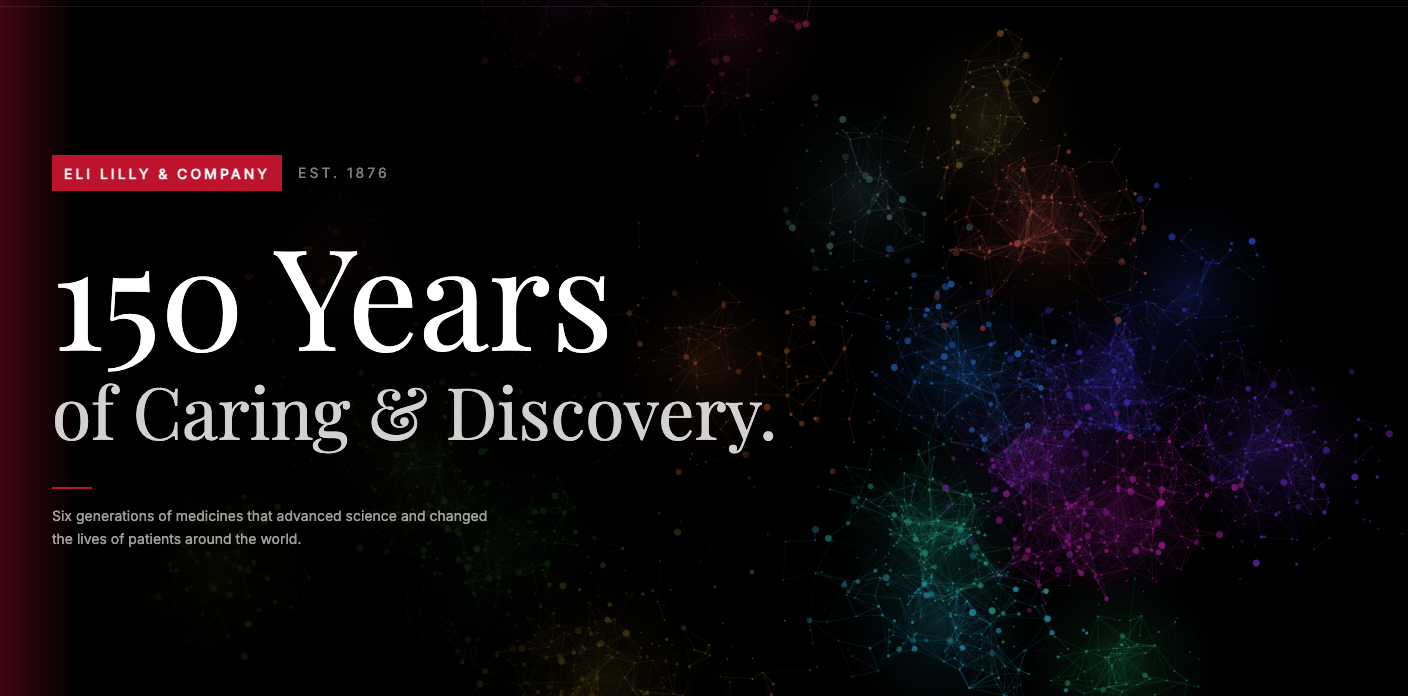
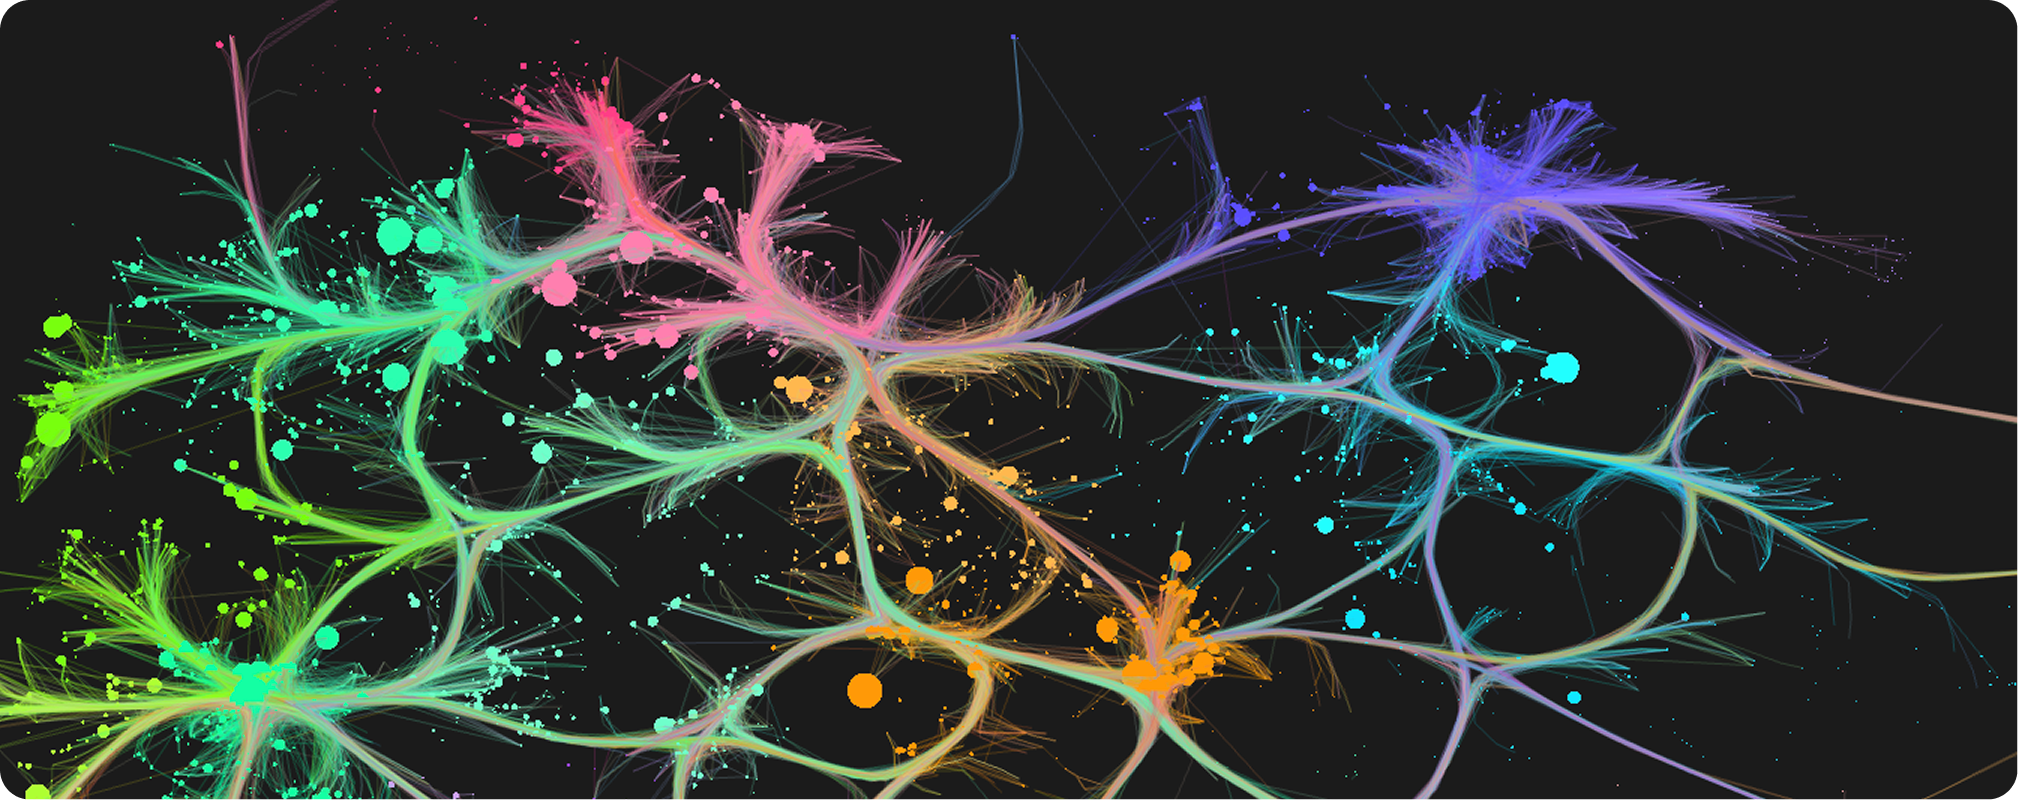
MedViz is an AI-powered biomedical literature visualization platform developed within biomedical AI research at the Yale School of Medicine, Department of Biomedical Informatics and Data Science. The work began with optimizing the overall interface: restructuring the UI from a scattered layout into a structured system, designing the interactive demo, refining the color legend for readability and accessibility, and introducing the temporal-distribution bar (2024 through early 2025). With a usable, structured platform in place, the work shifted toward data visualization and data storytelling: the MedViz Film documenting 30 years of Nature Medicine research (2025), and a data storytelling commission for Eli Lilly mapping 12,187 published research papers across 150 years of drug discovery (2026). Across both phases I have led the interface design, the visualization design, and the frontend implementation. The public platform is at medviz.org.